14 min read

After exploring Microsoft Fabric's pricing structure, strategies to maximize ROI, and its hidden costs that organizations should be aware of, it's time to address the million-dollar question (literally): Is Microsoft Fabric actually worth the investment?
The modern data stack has reached a critical point where traditional approaches no longer meet enterprise demands. Organizations deeply invested in the Microsoft stack might get more value from Fabric (e.g. leveraging existing Power BI investments or Azure Synapse expertise) and possibly even benefit from reserved capacity discounts. Yet many teams still wrestle with fragmented tools, soaring costs, and delayed insights.
Consider the current market pressures:
- Data volumes doubling every 18-24 months
- Analytics team productivity plateauing despite tool proliferation
- Integration complexity consuming 40-60% of project timelines
- Competitive pressure demanding faster, data-driven decisions
Microsoft Fabric promises to address these challenges through unification. But promises don't pay.
Understanding Microsoft Fabric's true investment requirements has become crucial as organizations evaluate this unified analytics platform. Recent analysis using Microsoft's official SKU estimator reveals significant gaps between initial capacity planning assumptions and real-world requirements, fundamentally changing the perspective toward ROI for organizations.
Special thanks to Ruairidh Smith, Managing Consultant at E-mergo, whose real-world SKU-optimization expertise sharpened and grounded our analysis.
The Capacity Planning Reality
Accurate capacity estimation forms the foundation of any successful Fabric investment decision. Evidence from Microsoft's official capacity estimator indicates that Fabric deployments require much higher capacity than simplified planning models suggest.
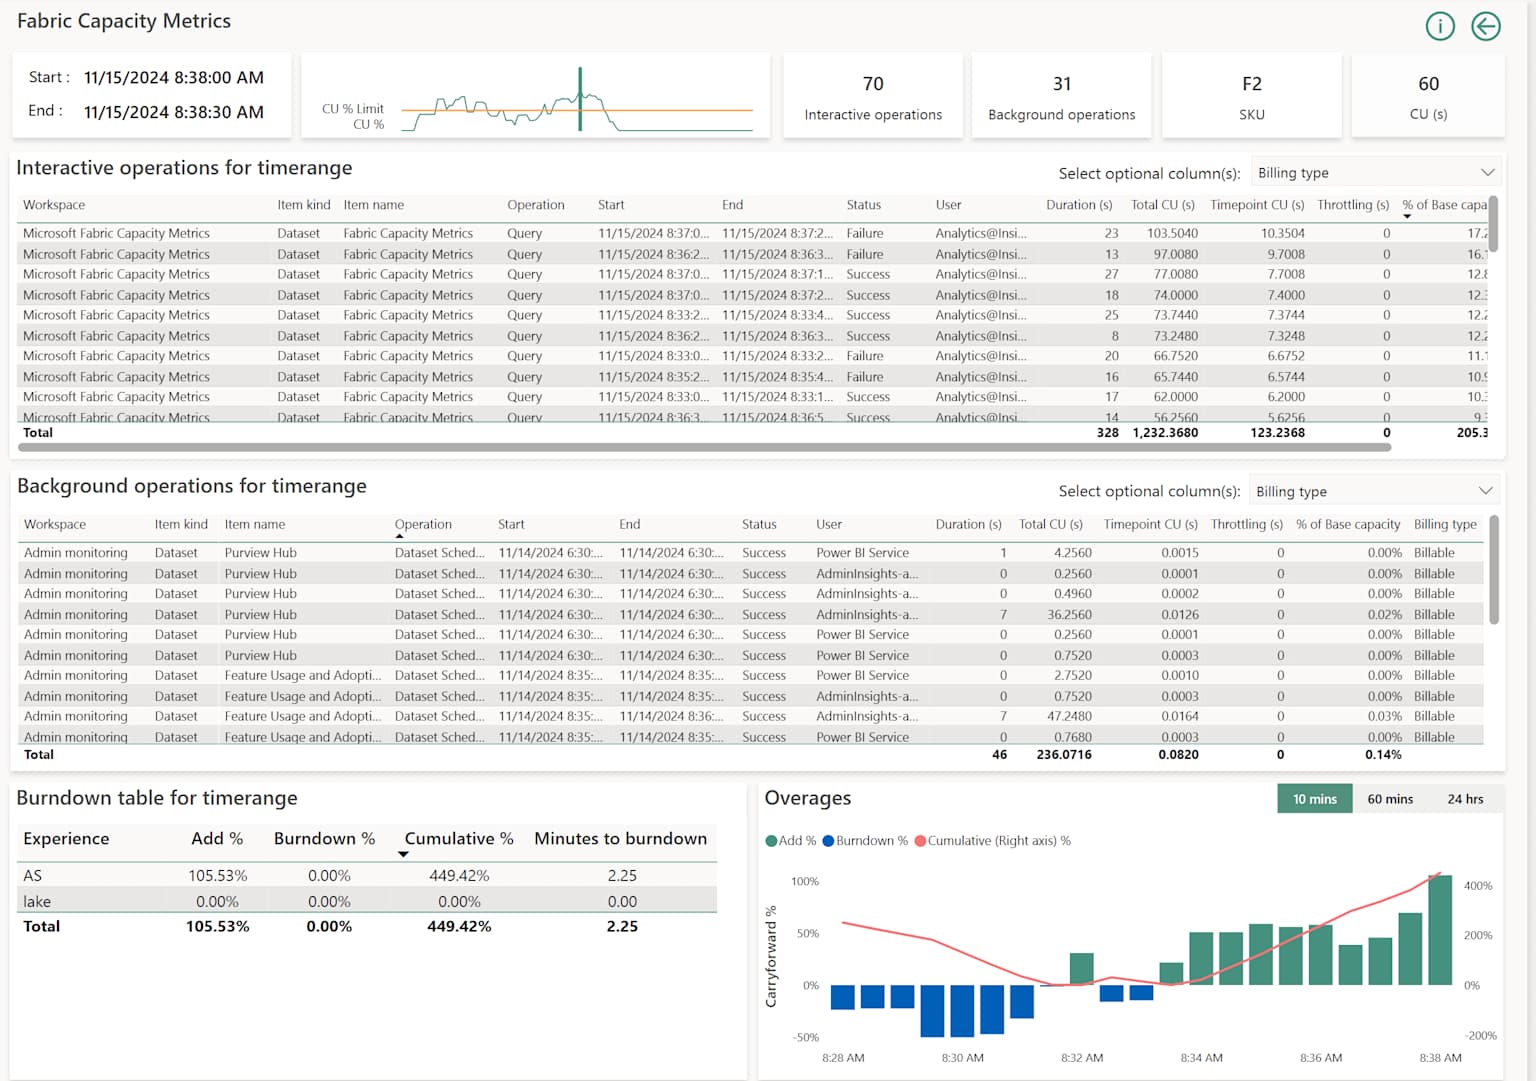
A detailed view of Fabric Capacity Metrics in Microsoft Fabric; including interactive operations, background operations, and resource consumption.
The Fabric SKU Estimator (Preview) explicitly analyzes data size, processing volume, and workload demands to recommend higher SKUs than basic assumptions. Simplified models often ignore Spark overhead (12-46% of capacity) and concurrent workloads. Small organizations face F32 requirements instead of F2-F8 assumptions. Beyond that is considered a large enterprise and Microsoft’s SKU documentation caps single capacities at F2048, requiring workload splitting for larger deployments. Let’s explore each scenario that’s grounded as close to reality as possible.
Scenario 1: Small Organization Implementation Strategy
This scenario represents a departmental or mid-size company deployment with 2,048 GB of compressed data, single daily batch cycles, and 400 tables across data sources. This configuration utilizes Data Factory, Spark Jobs, and Power BI workloads with minimal processing requirements. The workload distribution shows Data Factory consuming 4% of capacity, Spark Jobs 6%, and Power BI representing the largest component at 50% of total capacity consumption. This pattern shows a reporting-heavy environment with limited data transformation requirements.
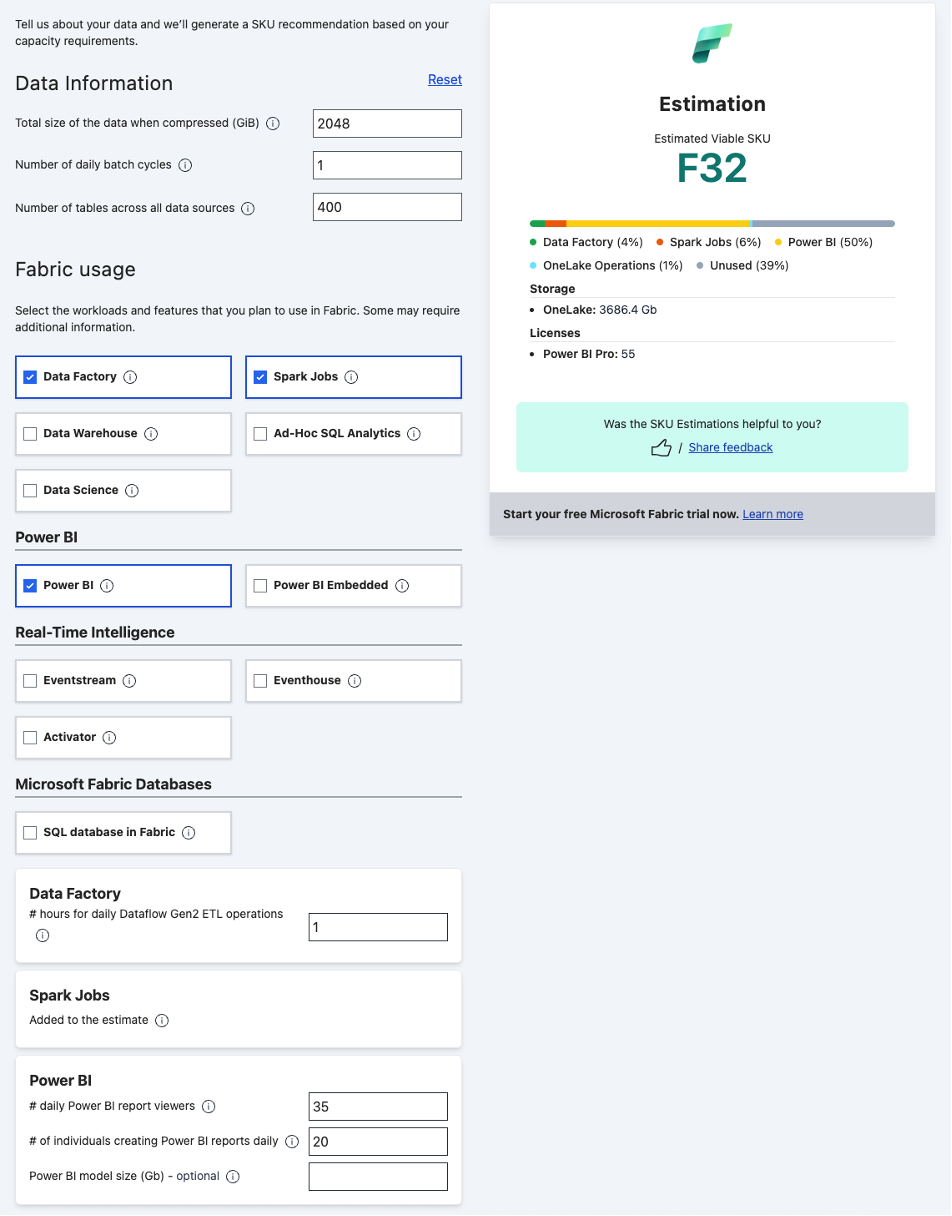
Microsoft Fabric SKU Estimator results for small organization showing F32 capacity requirement
The storage allocation of 3,686 GB in OneLake demonstrates efficient data compression ratios, while the requirement for 55 Power BI Pro licenses suggests a moderate user base primarily focused on business intelligence consumption rather than data engineering. The single daily batch cycle indicates predictable processing patterns suitable for off-peak scheduling, which could enable cost optimization through capacity pause functionality during non-business hours.
For organizations processing 2TB of data with 1 daily refresh cycle, Microsoft's SKU estimator mandates F32 capacity (32 CU) despite initial assumptions of F4 sufficiency. This discrepancy stems from underappreciated Power BI consumption patterns requiring sustained compute resources for report rendering and dataset queries, combined with Spark job concurrency needs during daily batch processing windows. The estimator's workload-aware calculations override basic CU projections by factoring in simultaneous workload execution and buffer capacity for usage spikes. The calculator shows 39% unused capacity (12.48 CU), indicating the F32 recommendation provides adequate headroom for operational stability.
Scenario 2: Medium Enterprise Growth Considerations
The medium enterprise implementation scales significantly with 20,480 GB of compressed data, 4 daily batch cycles, and 5,000 tables across multiple data sources. The workload composition shifts toward more intensive data processing, with Data Factory accounting for 5% of capacity, Spark Jobs increasing to 18%, and Power BI maintaining 25% of total consumption. This distribution reflects a more balanced analytical environment with substantial data transformation requirements alongside reporting needs.
 Microsoft Fabric SKU Estimator results for medium organization showing F512 capacity requirement
Storage requirements expand to 36,864 GB in OneLake, representing a ten-fold increase from the small scenario while maintaining efficient compression ratios. The reduction to 25 Power BI Pro licenses, despite increased data volume, suggests a more specialized user base with advanced analytical capabilities rather than broad organizational consumption. The increase to 4 daily batch cycles indicates more complex data pipelines with potential real-time or near real-time processing requirements.
Medium enterprises managing 20TB datasets with 4 daily cycles require F512 capacity (512 CU), showing 49% unused capacity for operational stability. This buffer accommodates concurrent Power BI report consumption spikes during business hours while maintaining headroom for unplanned data pipeline executions. The reserved capacity strategy aligns with hybrid approach for balancing predictable workloads with burst capability needs.
Scenario 3: Large Enterprise Optimization Framework
The large enterprise deployment represents a comprehensive organizational implementation with 102,400 GB of compressed data, 8 daily batch cycles, and 100,000 tables across numerous data sources. The workload distribution shows Data Factory consuming 15% of capacity, Spark Jobs requiring 80% of total resources, and Power BI accounting for 1% of consumption. This pattern indicates a data-intensive environment prioritizing large-scale data transformation and analytics over traditional reporting.
 Microsoft Fabric SKU Estimator results for large enterprise recommending split workloads for capacity requirement
Storage allocation reaches 184,320 GB in OneLake, demonstrating enterprise-scale data management requirements. The deployment supports 100 Power BI Pro licenses, indicating broad organizational access to business intelligence capabilities. The 8 daily batch cycles suggest complex, mission-critical data pipelines with strict service level agreements and potential 24/7 processing requirements.
Enterprise-scale deployments processing 100TB+ data with 100,000+ tables exceed Microsoft's current F2048 capacity ceiling. The estimator's ">F2048" recommendation triggers architectural considerations including multi-capacity workload distribution, Spark processing intensity at 80% consumption, regional capacity placement for data locality optimization, and cross-capacity governance complexity. This scenario demonstrates Fabric's current limitations at enterprise scale, requiring sophisticated deployment strategies beyond single-capacity models.
The Financial Impact Analysis
Translating capacity requirements into financial projections reveals the true investment magnitude for Fabric adoption. These calculations incorporate current Microsoft pricing, realistic growth patterns, and comprehensive cost components beyond basic capacity fees.
Cost Components
Investments beyond capacity pricing include storage, licensing, implementation services, and operational overhead. Each component scales differently with organizational size and usage patterns.
- Fabric Capacity Costs is the primary expense driver, ranging from F32 reserved pricing (~$3,200/month) to F512+ requirements exceeding $40,000 monthly. Pay-as-you-go rates run approximately 67% higher than reserved pricing, making annual commitments financially prudent for sustained workloads.
- OneLake Storage billing at $23/TB/month creates substantial long-term costs for data-intensive organizations. Growth from initial deployment volumes to steady-state operations often triples storage requirements within 24 months, generating significant budget pressure.
- Power BI Licensing requirements vary by capacity tier. Organizations below F64 capacity require Pro licenses ($14/user/month) for all content consumers, while F64+ deployments eliminate per-user fees for viewers, fundamentally altering the economics for user-intensive scenarios.
- Implementation Services encompass migration consulting, training programs, and change management initiatives. Conservative estimates range from $15,000 for small deployments to $200,000+ for enterprise transformations, with complexity varying significantly based on legacy system integration requirements.
With that, let's look at the respective numbers.
Note: The cost projections below reflect Microsoft Fabric architecture and pricing as of June 2025. Figures assume 3:1 data compression and early-adopter usage patterns. Actual costs may shift as Microsoft refines capacity-allocation algorithms and production workloads mature.
Small Organization Investment Reality
Calculator-based capacity requirements show that small organization economics remain viable with accurate pricing analysis. Projections based on F32 capacity show total three-year investment of $136,463, representing a significantly lower cost than initially projected. The cost breakdown includes F32 capacity at $90,036, OneLake storage at $3,707, Power BI Pro licenses at $27,720, and implementation services at $15,000 over three years.
|
Cost Component |
3-Year Total |
Monthly Average |
|
F32 Capacity (Reserved) |
$90,036 |
$2,501 |
|
OneLake Storage (3.7TB→5.3TB) |
$3,707 |
$103 |
|
Power BI Pro Licenses (55 users) |
$27,720 |
$770 |
|
Implementation Services |
$15,000 |
- |
|
Total Investment |
$136,463 |
$3,374 |
Microsoft's Fabric SKU Estimator confirms that a workload of 2,048 GiB compressed data spread across 400 tables with one daily refresh cycle requires F32 capacity, leaving 39% unused capacity for headroom. Pay-as-you-go pricing for F32 is $4,204.80 per month, but a reserved-capacity commitment reduces costs to $2,501 monthly, representing a 40% discount that Microsoft positions as the break-even point for workloads running more than 60% of the time.
Adding Fabric's ancillary costs provides the complete monthly operational picture. OneLake storage, priced at $23 per TB monthly, brings the initial 3.69 TB footprint to $85 monthly. With 20% annual data growth, average storage costs $103 monthly over three years. Fifty-five Power BI Pro licenses at $14 each contribute $770 monthly, reflecting the April 2025 pricing increase. Assuming a six-month onboarding engagement, external implementation services average $2,500 monthly during deployment, aligning with market rates for ETL and integration services for smaller teams. The steady-state operating cost totals $3,374 monthly, peaking at $5,874 during initial implementation.
Extrapolated over three years with 20% annual data growth, the total cost of ownership reaches $136,463. Comparing this to a conventional on-premises stack running SQL Server licensing ($1,500), ETL maintenance ($2,000), and infrastructure ($800) at $4,300 monthly, Fabric delivers $926 monthly savings. When factoring in an estimated 25% productivity improvement valued at $500 monthly, the combined benefit totals $1,426 monthly. Over three years, this generates $51,336 in total benefits against the $136,463 investment, yielding a positive ROI of approximately 27%. The analysis shows that proper F32 sizing maintains a favorable business case for small organizations with structured data analytics requirements.
Medium Organization Investment Reality
For a mid-market organization with traditional operations and tight analytics budget, the capacity-based cost structure creates significant financial considerations. F512 capacity requirements drive medium organization costs to $1.77 million over three years, an investment that requires careful justification and multi-year budget planning.
F512 capacity accounts for $1.44 million of the total investment, with implementation services adding $288,000, OneLake storage contributing $30,553, and Power BI licensing requiring $12,600 over three years.
|
Cost Component |
3-Year Total |
Monthly Average |
|
F512 Capacity (Reserved) |
$1,440,756 |
$40,021 |
|
OneLake Storage (36.9TB) |
$30,553 |
$848 |
|
Power BI Licensing (25) |
$12,600 |
$350 |
|
Implementation Services |
$288,000 |
- |
|
Total Investment |
$1,771,909 |
$49,220 |
For a mid-tier enterprise managing 20,480 GB compressed data across 5,000 tables with four daily refresh cycles, Microsoft's SKU Estimator recommends F512 capacity with 49% unused capacity for operational headroom. The pay-as-you-go rate reaches $67,277 monthly, while reserved capacity pricing reduces costs to $40,021 monthly, delivering approximately 40% savings for committed workloads. OneLake storage for the 36.9 TB footprint costs $848 monthly at current pricing of $23 per TB. The core team of 25 Power BI Pro users adds $350 monthly at the updated $14 per user rate effective April 2025. Enterprise-scale implementation typically requires external expertise at $8,000 monthly throughout the deployment period, bringing steady-state operational costs to $41,219 monthly, peaking at $49,219 during active implementation phases.
The three-year total cost of ownership reaches $1.77 million based on current Microsoft pricing. Replacing a traditional enterprise architecture including data warehouse appliances ($15,000 monthly), ETL tooling ($8,000 monthly), BI platform licenses ($12,000 monthly), and infrastructure operations ($10,000 monthly) generates $45,000 in monthly cost avoidance. However, this creates a net monthly deficit of $4,219 against Fabric operational costs. Even accounting for productivity improvements of 40% valued at $8,000 monthly in enhanced staff throughput, the combined monthly benefit of $3,781 cannot offset the higher Fabric costs. Over three years, this results in a negative ROI requiring organizations to demonstrate exceptional productivity gains and measurable business value beyond traditional cost displacement to justify the F512 investment.
Large Organization Investment Complexity
Enterprise scenarios exceeding F2048 limits create substantial financial and architectural challenges requiring sophisticated multi-capacity planning approaches. The $15.2 million investment requirement positions Fabric as a major platform transformation comparable to ERP implementations. Multi-capacity infrastructure costs reach $14.4 million, implementation services add $600,000, OneLake storage contributes $152,352, and Power BI licensing requires $50,400 over three years.
|
Cost Component |
3-Year Total |
Considerations |
|
Multi-Capacity Infrastructure |
$14,407,704 |
3×F1024, 3×F512, 2×F256 reserved pricing |
|
OneLake Storage (184TB) |
$152,352 |
Enterprise data lifecycle management |
|
Power BI Licensing (100 users) |
$50,000 |
Minimal per-user impact at scale |
|
Implementation Services |
$600,000 |
Multi-phase transformation program |
|
Total Investment |
$15,210,456 |
Requires board-level approval |
At the enterprise scale with 100,000 GB compressed data across 100,000 tables and eight daily refresh cycles, Microsoft's SKU Estimator indicates requirements exceeding the F2048 capacity limit, necessitating workload distribution across multiple capacities. A logical enterprise architecture deploys three F1024 capacities for production workloads, two F512 instances for regional disaster recovery, two F256 nodes for development and testing environments, and one additional F512 for real-time analytics processing. Current reserved pricing positions F1024 at $80,043 monthly, F512 at $40,021 monthly, and F256 at $20,011 monthly. The combined capacity costs total $400,214 monthly before storage and licensing.
Enterprise-scale OneLake storage requirements of 184 TB generate $4,232 in monthly costs at current pricing of $23 per TB. The Power BI creator pool of 100 users contributes $1,400 monthly at the updated $14 per user rate effective April 2025. A comprehensive two-year enterprise implementation typically requires external expertise averaging $25,000 monthly throughout the deployment period. The steady-state operational cost reaches $405,846 monthly, increasing to $430,846 during active implementation phases.
The three-year total cost of ownership totals $15.2 million. Decommissioning legacy enterprise data warehouse appliances ($180,000 monthly), distributed ETL frameworks ($80,000 monthly), enterprise BI platform licensing ($120,000 monthly), and operational overhead ($150,000 monthly) generates $530,000 in monthly cost avoidance. This creates a net monthly savings of $124,154 against Fabric operational costs. However, even accounting for substantial productivity improvements of 50% valued at $200,000 monthly in enhanced enterprise throughput, the combined monthly benefit of $324,154 provides a three-year ROI of approximately 36%. At hyperscale, Fabric represents a strategic capability investment that delivers positive returns through operational transformation rather than simple cost displacement.
Platform Maturity and Risk Assessment
Beyond financial considerations, organizations must evaluate Fabric's operational maturity and reliability patterns when making investment decisions. Recent experiences amongst user communities have raised important considerations for production deployment planning.
Service Reliability Patterns
Microsoft Fabric's operational track record shows concerning reliability patterns that impact production deployment decisions. Analysis of outage frequency and duration uncover the following aspects:
- Multi-Regional Impact: Recent outages have affected multiple continents simultaneously, with Europe and North America experiencing concurrent 4-12+ hour disruptions. These events demonstrate Fabric's vulnerability to platform-wide failures affecting global operations.
- Status Page Accuracy: Community reports indicate significant delays between actual service disruption and official status page updates, creating challenges for operational teams attempting to distinguish between local and platform-wide issues.
- Recovery Characteristics: Platform failures often trigger read-only mode during regional failover processes, limiting business operations even during partial recovery phases.
Organizations planning mission-critical deployments should incorporate business continuity planning for extended outages and consider hybrid architectures maintaining alternative analytics capabilities.
Enterprise Feature Limitations
Several enterprise-critical features demonstrate maturity gaps requiring careful evaluation.
- Private Link Constraints: Microsoft documentation indicates Private Link support for Fabric remains problematic for production environments, with capacity limits of 450 per tenant and performance challenges noted by Microsoft engineers. Organizations with strict network isolation requirements face significant deployment obstacles.
- Capacity Scaling Boundaries: The F2048 maximum capacity limit creates architectural complexity for large-scale deployments, forcing multi-capacity designs with associated governance overhead and potential performance implications.
- Multi-Environment Management: Development, testing, and production environment isolation requires multiple capacity provisioning, substantially increasing operational costs and complexity beyond single-capacity assumptions.
Risk-Adjusted ROI Models
Organizations considering Microsoft Fabric investments face significant variability in return on investment based on actual capacity requirements versus initial projections. We analyzed how ROI sensitivity changes across small, medium, and large organizations when capacity assumptions scale from optimistic baseline (1x) to conservative enterprise sizing (13x multiplier).
The ROI sensitivity models the three distinct organizational scenarios:
- Small organizations utilize F32 capacity with a baseline three-year investment of $136,463, achieving 27% ROI under optimal conditions.
- Medium organizations require F512 capacity with $1.77 million investment, facing negative 8.5% ROI at baseline.
- Large enterprises deploy multi-capacity architecture requiring $15.2 million investment, generating 36% baseline ROI through economies of scale.
Capacity multipliers represent scaling factors applied to initial sizing assumptions, accounting for data growth, workload expansion, and conservative provisioning practices. The analysis includes diminishing returns on productivity benefits and cost avoidance as capacity scales beyond optimal levels.
Note: The ROI figures remain indicative. Because Fabric’s architecture is still in flux, organizations should confirm assumptions in controlled pilots before large-scale roll-outs.
ROI Sensitivity Analysis by Organization Size
Small Organizations (F32 Capacity): Show the steepest ROI deterioration under capacity scaling scenarios. At baseline 1x capacity, these organizations achieve positive 27% ROI through effective cost displacement and productivity improvements. However, ROI becomes negative at 2x capacity multiplier, reaching severe negative returns of -103% at 6x scaling. This rapid decline reflects over-provisioning penalties and limited ability to realize proportional benefits from excess capacity.
Medium Organizations (F512 Capacity): These face immediate ROI challenges, starting with negative 8.5% baseline returns. Capacity scaling exacerbates these challenges, with ROI declining to -103% at 10x multiplier. The negative trajectory reflects scale economics misalignment, where traditional mid-market budgets struggle to justify enterprise-level capacity investments without corresponding productivity transformations.
Large Organizations (Multi-Capacity Architecture): These maintain positive ROI longest, achieving optimal 46% returns at 2x capacity multiplier before declining. Break-even occurs at 5x multiplier, with severe negative returns beginning at 12x scaling. This resilience reflects superior economies of scale and enhanced ability to distribute capacity costs across multiple business units and use cases.
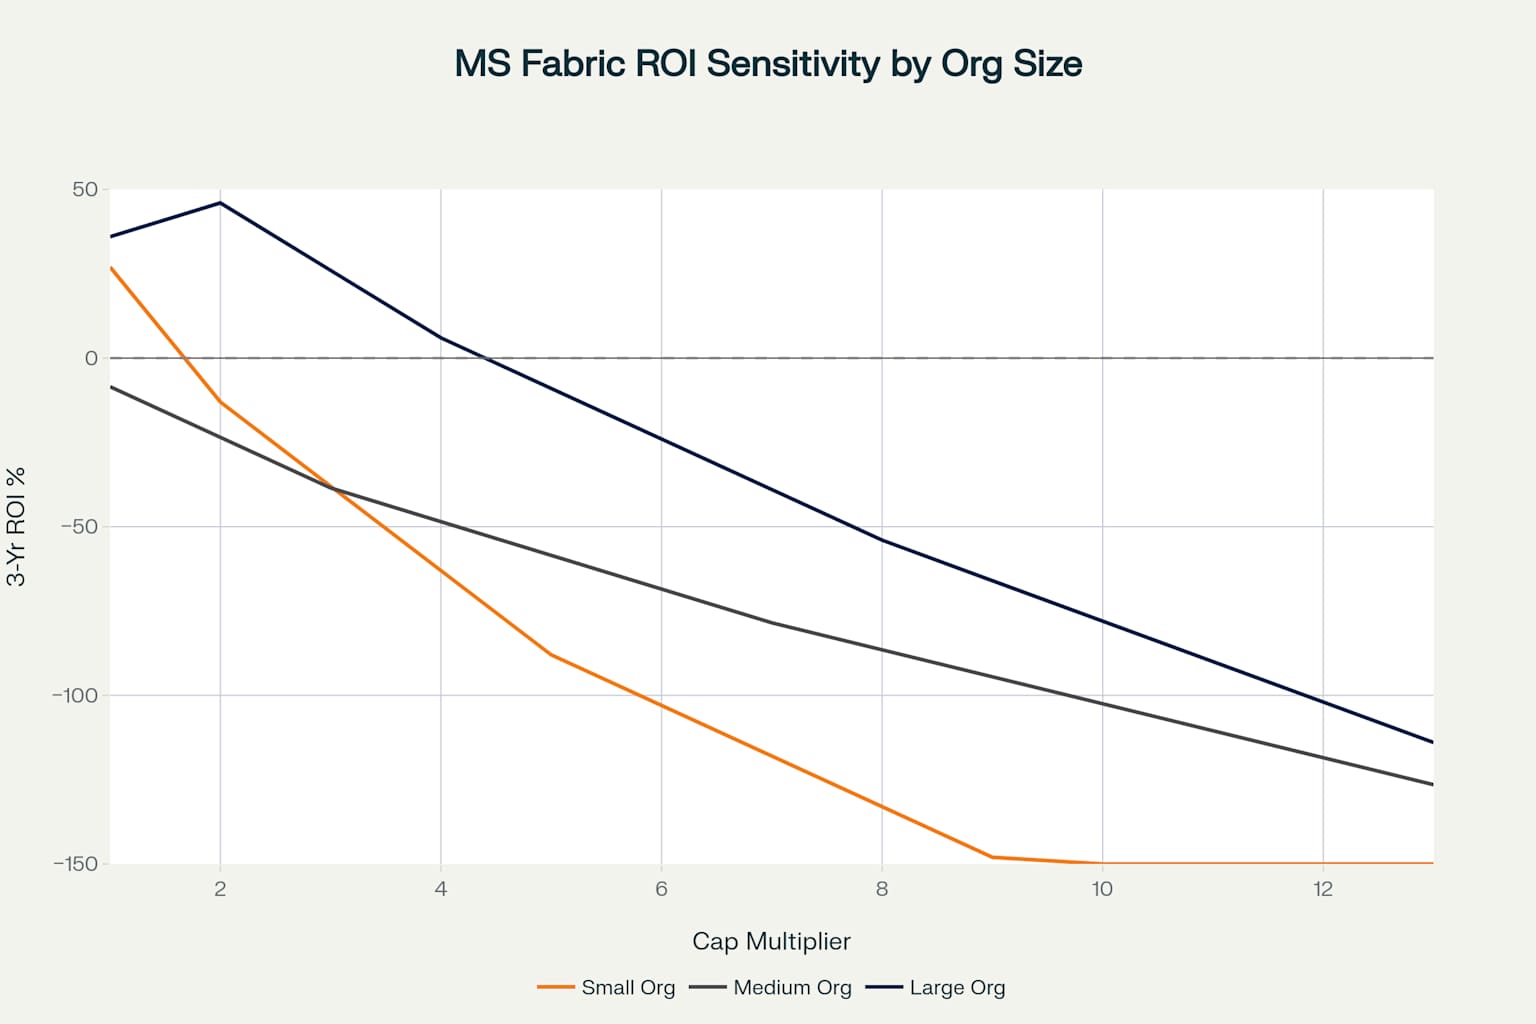 ROI sensitivity analysis showing how Microsoft Fabric investment returns change with capacity scaling assumptions
Break-Even Threshold Analysis
The break-even analysis reveals fundamental differences in how organizations absorb capacity scaling costs while maintaining Microsoft Fabric investment viability.
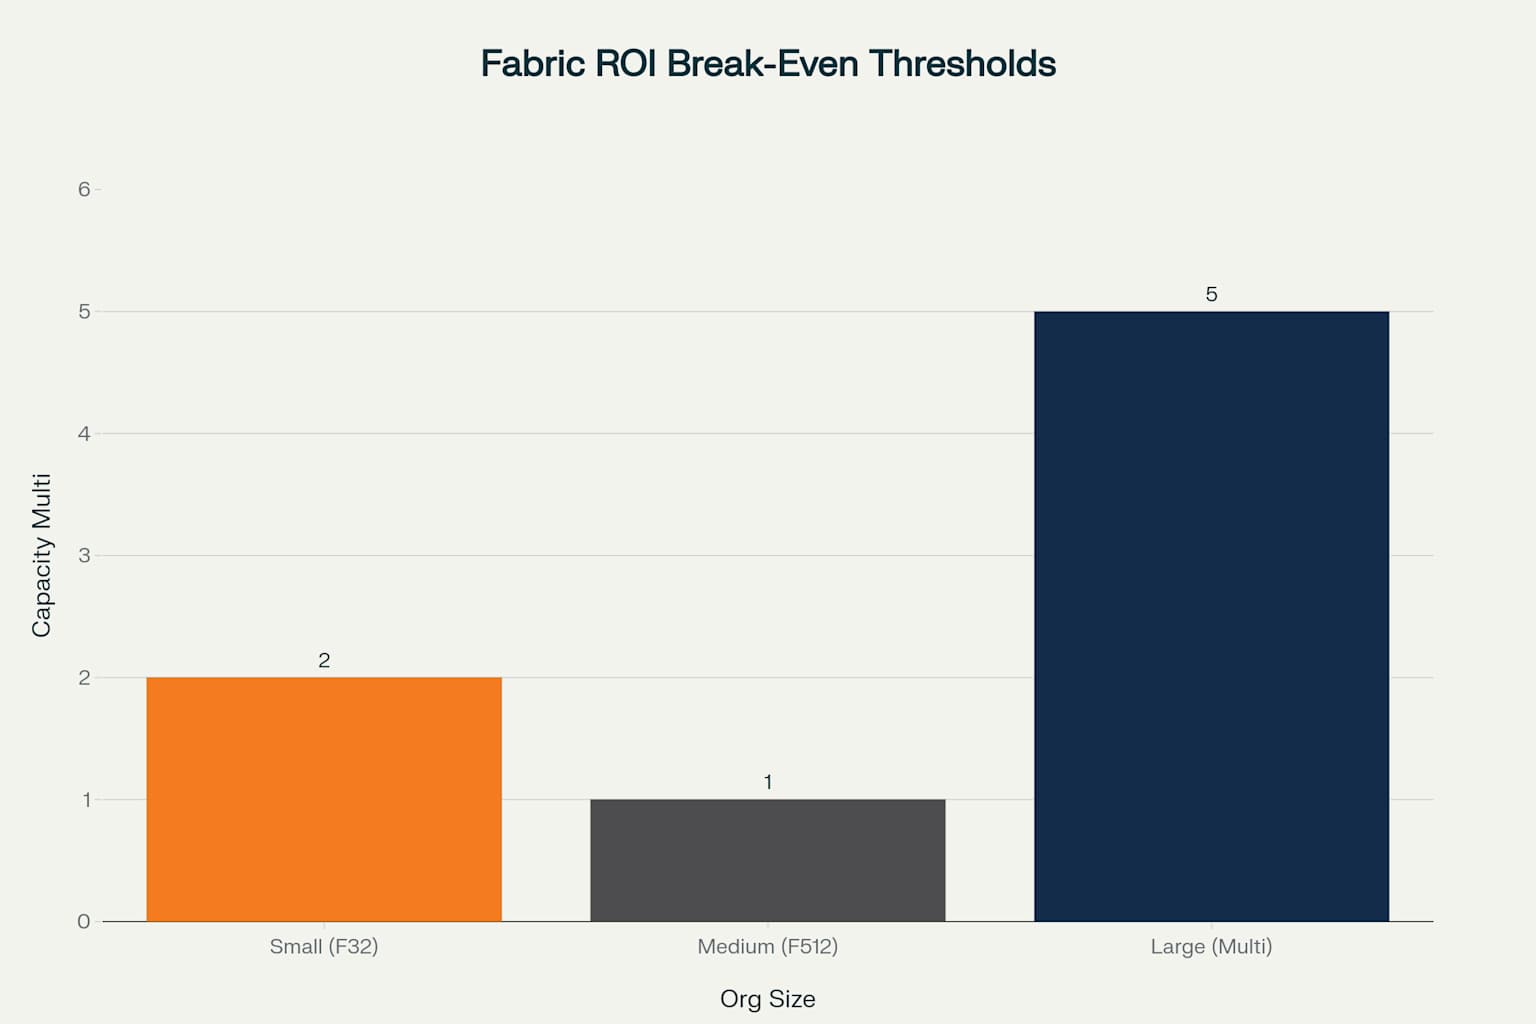
Break-even analysis showing capacity multipliers where Microsoft Fabric ROI turns negative for different organization sizes
Small organizations demonstrate the most restrictive scaling tolerance, losing investment viability after 2x capacity scaling due to limited workload diversity and reduced economies of scale. When capacity scales beyond F32 baseline requirements, small organizations lack sufficient analytical use cases to utilize additional compute resources effectively, unlike larger enterprises with multiple business units and diverse workload requirements. The F32 capacity already provides 39% unused capacity for operational headroom, and scaling to 2x capacity creates dramatically higher costs while maintaining similar analytical outputs, causing cost-per-transaction increases that cannot be justified through expanded business value.
Medium organizations face immediate viability challenges, starting with negative ROI at baseline F512 capacity requirements. This structural misalignment reflects the disconnect between traditional mid-market budgets and enterprise-level capacity pricing, where the $1.77 million three-year investment exceeds typical mid-market IT allocations. F512 capacity provides enterprise-level compute resources with enterprise-level costs, but medium organizations typically operate with limited ability to generate the 40% productivity improvements required to offset the capacity investment. The cost differential between maintaining existing legacy systems and adopting F512 capacity creates immediate negative cash flow that requires substantial organizational transformation beyond simple technology deployment.
Large organizations maintain positive ROI through 5x capacity scaling due to superior economies of scale and enhanced capability utilization. Multi-capacity architectures enable effective workload distribution across production, development, disaster recovery, and real-time analytics environments, maintaining cost-effectiveness even at higher capacity multipliers. Large organizations can leverage capacity scaling to drive enterprise-wide operational transformations that generate proportional productivity improvements, often evaluating Microsoft Fabric investments as strategic capability acquisitions rather than simple cost displacement initiatives. This perspective enables tolerance for higher capacity costs when investments deliver competitive advantages and operational efficiencies that justify premium pricing.
The analysis identifies three primary risk factors affecting ROI sensitivity. Small organizations face over-provisioning risks due to limited workload diversity and reduced ability to fully utilize excess capacity. Medium organizations encounter scale economics challenges where capacity costs outweigh productivity benefits. Large organizations confront complexity costs as multi-capacity architectures increase operational overhead and implementation complexity.
| Organization Size | Baseline ROI (1x) | Break-Even Threshold | Severe Risk Threshold | 3-Year Investment | Primary Risk Factor |
|---|---|---|---|---|---|
| Small (F32) | 27.0% | 2x multiplier | 6x multiplier (-103%) | $136,463 | Over-provisioning |
| Medium (F512) | -8.5% | Already negative | 10x multiplier (-103%) | $1,771,909 | Scale economics |
| Large (Multi-capacity) | 36.0% | 5x multiplier | 12x multiplier (-102%) | $15,210,456 | Complexity costs |
Organizations should implement capacity planning methodologies that account for ROI sensitivity thresholds when evaluating Microsoft Fabric investments. Small organizations should prioritize precise capacity sizing to maintain positive returns, avoiding speculative over-provisioning beyond 2x baseline requirements. Medium organizations require demonstrated productivity improvements exceeding 40% to justify F512 investments, necessitating comprehensive change management and process optimization initiatives.
Large enterprises should leverage multi-capacity architecture benefits while monitoring complexity costs that emerge beyond 5x scaling. Investment decisions should incorporate break-even analysis and establish capacity governance frameworks to prevent ROI deterioration through uncontrolled scaling.
Mitigation Strategies and Best Practices
Organizations committed to Fabric investment can implement several strategies to optimize costs and improve success probability, though fundamental economics remain challenging under realistic capacity requirements.
Capacity Optimization Techniques
- Workload Scheduling: Implementing intelligent scheduling to avoid concurrent peak operations can reduce burst capacity requirements and enable smaller base capacity provisioning with pay-as-you-go scaling for peak periods.
- Data Lifecycle Management: Aggressive data archival and retention policies prevent OneLake storage costs from escalating beyond projected levels. Organizations should implement automated lifecycle policies moving cold data to lower-cost storage tiers.
- Multi-Capacity Architecture: Large organizations should design workload distribution strategies across multiple smaller capacities rather than pursuing maximum single-capacity deployment, enabling better cost control and operational isolation.
Implementation Risk Reduction
- Pilot-First Approach: Organizations should begin with limited-scope pilots using pay-as-you-go capacity to validate actual consumption patterns before committing to reserved capacity investments.
- Gradual Migration Strategy: Phased migration from legacy systems enables organizations to validate benefits and adjust capacity planning based on real-world usage patterns rather than theoretical projections.
- Vendor Partnership: Engaging experienced implementation partners familiar with Fabric capacity optimization can significantly reduce implementation costs and accelerate time-to-value realization.
Alternative Architectural Approaches
- Hybrid Platform Strategy: Organizations can implement Fabric for specific high-value workloads while maintaining existing systems for routine operations, reducing overall platform investment while capturing targeted benefits.
- Third-Party Optimization Tools: Solutions like TimeXtender can potentially reduce Fabric capacity consumption through optimized code generation and intelligent orchestration, though specific reduction percentages require validation in production environments.
Strategic Decision Framework
Given the substantial gap between initial capacity assumptions and Microsoft calculator recommendations, organizations need structured decision frameworks for evaluating Fabric investments.
Investment Readiness Assessment
Organizations should evaluate Fabric readiness across multiple dimensions:
- Financial Capacity: Ability to sustain 4-8x higher investment levels than initially projected, with multi-year budget commitment and executive sponsorship for significant platform transformation.
- Operational Maturity: Capability to manage complex multi-capacity architectures, implement sophisticated cost controls, and maintain business continuity during platform outages.
- Business Transformation Scope: Justification based on comprehensive business process improvement rather than analytics modernization alone, requiring substantial productivity and efficiency gains.
Go/No-Go Decision Criteria
Proceed with Fabric investment when:
- Organizations can justify $2M+ three-year investments based on comprehensive business transformation
- Executive sponsorship exists for multi-year platform adoption with associated risk
- Technical teams demonstrate capacity to manage complex multi-capacity architectures
- Business cases incorporate realistic capacity requirements and conservative benefit assumptions
Consider alternative approaches when:
- Investment levels exceed organizational risk tolerance or financial capacity
- Business cases depend primarily on optimistic productivity assumptions
- Limited technical resources for managing platform complexity
- Mission-critical operations cannot tolerate extended outage scenarios
Microsoft Fabric's potential remains significant for organizations with appropriate investment capacity and comprehensive transformation scope. However, success requires realistic capacity planning, substantial financial commitment, and sophisticated implementation strategies addressing platform maturity limitations. Organizations proceeding should do so with a clear understanding of actual investment requirements and associated implementation complexities.
The path to Fabric ROI exists, but it demands careful navigation of capacity reality, platform maturity constraints, and financial commitment substantially beyond initial expectations. For modern data teams seeking to bridge this gap, automate with TimeXtender and accelerate Fabric's ROI.