


2 min read
Is this KPI Upward (floating) or Downward (Spiralling)?
KPI's and value
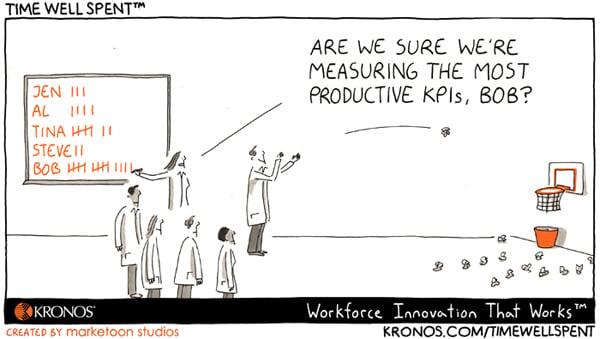
Frequently, we hear that companies have too many Key Performance Indicators. There are KPI's to support strategy, KPI's to support day-to-day operations. KPI's can be considered leading or lagging, inward (company) or outward (world) focussed. Should you be so inclined, feel free to check out the book by Bernard Marr describing 75 KPI's, worthy of interest (roughly 3x as many KPI's as letters in the Alphabet).
When choosing or building a KPI structure for our organisation, we will likely need to answer this question:
Which set of KPI's will yield most value at any given point in time?
Fact remains: there are too many KPI's to choose from. Is there any tip we could offer, in order to help decide?
Why, yes - I believe we can.
About upward and downward KPI's
I would suggest adding an evaluation parameter. It seems to me that KPI's, whatever the goal they measure, tend to work either in an upward floating or downward spiralling mechanism.
Allow me to explain.
Downward (spiralling) KPI's
Examples of Downward KPI's are cost & profit margin elements.
They can only be optimized up to limit. There must be a boundary to how much margin you can generate before getting undercut by competition. There must be limit to how much cost you can save before you will get negative side-effects on customer service or delivery. Once we have reached these goals, this boundary, we will not be able to improve further. Any attempt to do so will require us to micro-manage side-effects. The KPI has reached an optimum.
We get to a defensive posture, needing to defend this optimum value. As a result, it may become harder to reach other goals. This may impact and hinder strategy overall. The problem is that the optimum value for profit margin is unknown. So is the optimum for saving cost. To some people it may seem that you will always be able to save more cost. This generates some negative spiral results, hence the name.
Another example of a downward KPI system is Just-In-Time (JIT). Once you have optimized your supply chain to become JIT, what will then be the next improvement, "Even-Juster-in-Time"? A limit has been reached and we go on the defence. Attempts to further improve supply gets pushed out further, putting pressure on other supply chain partners. Possibly to the detriment even of the whole JIT effort.
So, a downward KPI has an inbuilt, unknown limit. Optimizing this KPI beyond its optimum tends to generate side-effects, which then need to be micromanaged.
Upward (floating) KPI's
There are quite a few KPI's that have an opposite effect. The more you focus on these KPI's, the more opening you can create. There potential to drive value is limited only by the time and attention we dare give them. They offer the ability to draw in more stakeholders. They tend to unite. KPI's which focus on collaboration, innovation and other cross-functional behaviour (*) have these qualities.
Hard work and human nature
So why are so many KPI's downward, self-restricting being used in Decision support?
Working with downward KPI's tends to be easy. They are simple, easy to understand - easy to find. That's why Decision Support often revolves round them. Or at least, has been revolving round them since most of Business Intelligence history. Complacency and laziness, it turns out, can also creep into our Business Intelligence work.
Upward KPI's require more work.
Results of Business Intelligence which embraces Upward KPI's seems to be promising, to say the least.
(To be continued...)
(*) cross-functional behaviour - our ability to involve others (colleagues, partners, society) in creating and nurturing Business value.
Image credit: Kronos.com for reuse of cartoon